
On this page (8)Hide
A routine blood test already holds almost everything one of the best-known biological age scores needs. The harder question is how much that single number can tell you.
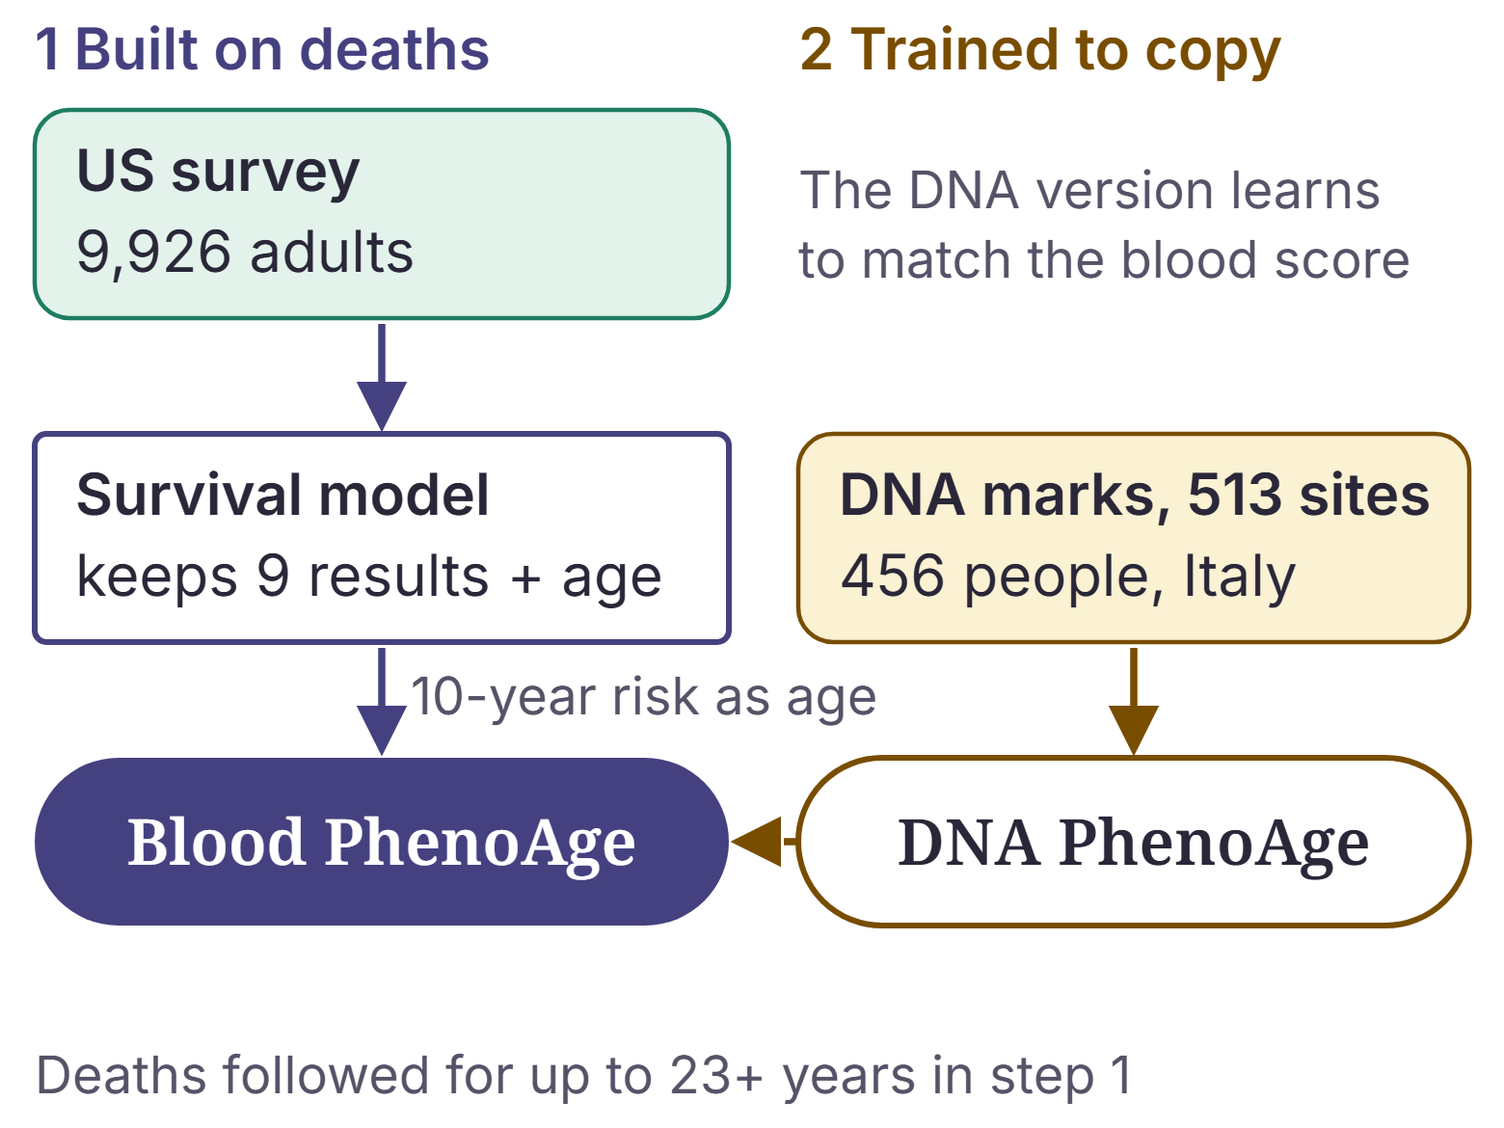
In 2018, Morgan Levine and colleagues built the score from 9,926 US adults whose deaths were followed for up to more than 23 years [1]. A survival model picked nine of 42 routine clinical measures that, with age, were linked with dying [1]. The predicted ten-year risk of dying is then written as an age: the age at which an average person in that survey had the same risk [1].
The same paper took a second step. Using blood from 456 people in Italy, it trained a DNA test to estimate the blood score from chemical marks at 513 places in the genome [1]. Both measures are now called PhenoAge, but they are not interchangeable. The DNA version learned to copy the blood score, and the authors found the blood score the better predictor of illness and death [1]. This article is mainly about the blood version, because anyone can get its inputs from an ordinary lab.
Five of the nine are chemistry results: inflammation (CRP), blood sugar (glucose), kidney filtering (creatinine), a blood protein made by the liver (albumin) and an enzyme from liver and bone (alkaline phosphatase) [1]. The other four describe blood cells: the white-cell count, the share of white cells that are lymphocytes, the average size of red cells and how much that size varies [1].
In the formula, higher albumin and a higher share of lymphocytes pull the score down, and higher values of the other seven push it up [1]. None of these is an ageing marker on its own. A result outside the normal range is a reason to talk to a doctor, not a biological age problem to fix.
The score was then checked in a separate US survey sample of 11,432 adults followed for up to 12.6 years. At the same calendar age and sex, each extra year of PhenoAge went with about 9% higher risk of dying during follow-up [2]. The figure was similar in men and women, and in White, Black and Hispanic Americans [2]. In more than 300,000 UK Biobank participants of European ancestry it was about 10% [3].
The score's years were set using deaths: one PhenoAge year stands for the rise in risk that a calendar year carries in the original model [1]. So a PhenoAge year is a unit of risk, not a separate measure of how fast you age. That the link held up in new groups of people is still a real finding. The more telling question is how much PhenoAge adds to what your age already says.
Here the answer is: a little. In the US sample, researchers measured how well a score tells apart people who died within ten years from those who survived, where 0.5 is a coin toss and 1.0 is perfect. It rose from 0.855 with age alone to 0.879 with PhenoAge [2]. In UK Biobank, a similar score for ranking who died sooner rose from 0.726 with age and sex to 0.750 [4]. That is a real gain for groups of people, not a forecast for one person. The studies also leave gaps: Asian participants were not analysed separately in the US data, and the UK analysis covered people of European ancestry only [2, 3].
Among the routine blood clocks we reviewed, PhenoAge is one of the most widely studied with a fixed formula anyone can use. It has been tested again in large US and UK groups, including by researchers outside the team that built it [3, 4].
| Clock | How it compares with PhenoAge | |
|---|---|---|
 | PhenoAge2018 · 9 results + age · public formula | Reference point; tested in US and UK groups |
| GOLD BioAge2025 · 9 results + age · public formula | About equal in one US comparison |
| UK Biobank 25-marker model2023 · 25 results, incl. extra tests | Somewhat better with more tests; UK only |
| LifeClock2025 · lab results and vital signs | Not compared on deaths |
A 2025 clock, GOLD BioAge, also uses nine blood results. In one US comparison it scored about the same as PhenoAge at ranking deaths [5]. A UK Biobank model scored somewhat better than PhenoAge, but it used 25 results, including tests a routine panel leaves out, all from that one biobank [4]. The largest record-based clock learned from 9.7 million people's hospital records, using lab results, vital signs and basic details. It was built to estimate calendar age in healthy people, and its published results report diseases rather than deaths [6].
The last step of the formula turns the risk into years, and its final constant is printed two ways. The 2018 paper's supplement prints 0.090165, while a 2019 correction from the same group and a 2021 UK study print 0.09165 [1, 3, 7]. Calculators copy one or the other; an open-source version used by researchers has 0.090165 [8]. Settling which is right would mean refitting the original survey data.
The difference is not tiny. In our calculations, the 0.09165 version reads about one to two years higher for the same blood, more for lower results. A unit slip can matter even more. The formula needs CRP in milligrams per decilitre, but many labs report milligrams per litre, a number ten times larger. Entering that by mistake adds about 2.4 years. Entering albumin in grams per decilitre instead of grams per litre can throw the result off by more than a decade.
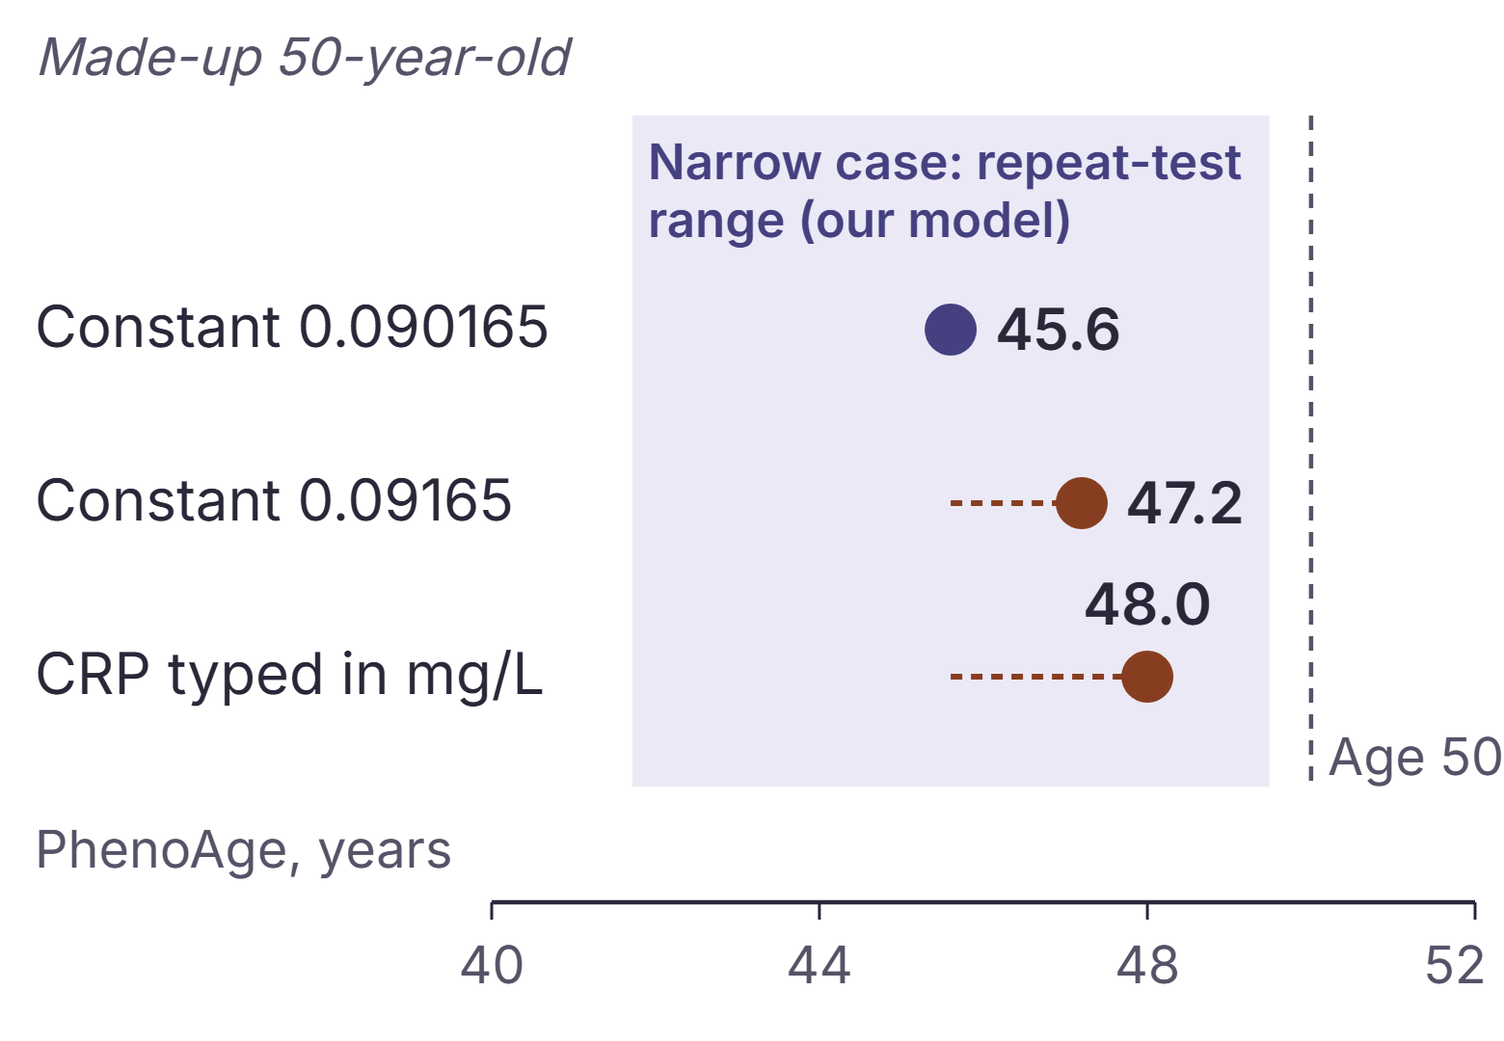
The nine results move from week to week even in healthy people. A European study sampled healthy adults every week for ten weeks. Within the same person, CRP varied by about 29%, glucose by about 5% and creatinine by about 4% [9]. White-cell counts varied by about 8 to 13% [10]. We combined published figures like these in a simple model. In that model, one result varies by about 1.4 to 2.3 years. So two single tests on the same person could differ by roughly four to six years with no lasting change. This is an illustration, not a measured fact. A study that tests the same people's blood PhenoAge twice, a few weeks apart, would settle the real size of this noise.
So a single small change, up or down, tells you little. Suppose a 50-year-old scores 48, then 50.5 two months later. That rise could still be ordinary variation. Likewise, a small drop after a new diet would not, on its own, show that the diet worked. An unusually high or low first result also tends to be less extreme the next time. Averaging two tests at each time point narrows the model's range to roughly three to five years.
DNA clocks have repeatability limits of their own. Run twice on the same blood sample, the original DNA PhenoAge differed by a median of 2.4 years and by up to 8.6 years, and a reworked version narrowed this [11]. Across blood draws taken minutes to days apart, around meals, stress and environmental exposures in small groups of young adults, most DNA clocks showed moderate-to-good agreement with themselves [12].
A group's average can move, but a lower score has not yet been shown to mean better health. In a six-month randomised trial in 181 Saudi adults with prediabetes, a structured lifestyle programme lowered average blood PhenoAge by 4.9 years, while the control group's rose by 1.3 years [13].
Trials of the DNA version are mixed. In a two-year trial of calorie restriction, a reworked DNA PhenoAge showed no detectable difference between the groups [14]. In a three-year trial of 777 older Swiss adults, omega-3 supplements went with a small slowing of about three months, in an analysis of four clocks without a formal correction for testing several at once [15]. A one-year study in nine men, with no comparison group, reported their DNA PhenoAge gap 3.7 years smaller [16]. A 2026 reanalysis found that some single-clock results may need re-examining, while other interventions moved several reliable clocks together [17].
You need three standard lab orders [18]. They are a full blood count with a white-cell breakdown, a comprehensive metabolic panel and a high-sensitivity CRP test; a basic metabolic panel lacks albumin and alkaline phosphatase. The six tests cost 4,770 Ft at one Hungarian lab's list prices, or 8,970 Ft (about €23) with its blood-draw fee [19]. Ask the lab whether its blood count report includes red-cell size variation and the lymphocyte share, because its price list does not say [19]. Through one US consumer lab the three orders cost about $150 [18]. Some UK longevity panels leave out the full blood count, so check the marker list before you buy [20].
Some services calculate the score for you. As of 12 November 2026, one US service quotes about $32 per panel through its network prices, by its own description [21]. If you calculate it yourself, these steps keep the number as honest as it can be:
- Fast for at least eight hours, as the US validation study required [2].
- Test when you are well. Heart-risk guidance on CRP says not to test during an infection and to repeat a markedly high result after about two weeks [22]. Applying that to the whole score is our extrapolation.
- Use the same lab each time, and check every unit against the formula, especially CRP.
- Take two tests a few weeks apart and use the average, as the same guidance advises for CRP [22].
- Write down which version of the formula you used, and compare only results made with the same one.
Evidence and methods
The formula. The 2018 supplement prints the final step as 141.50225 + ln(−0.00553 × ln(1 − M)) / 0.090165; the 2019 correction and a 2021 UK study print 141.50 + ln[−0.00553 × ln(1 − M)] / 0.09165 [1, 3, 7]. The 2018 PLoS Medicine paper first printed different weights for glucose and red-cell size variation; the correction, which says it adds a missing step, prints values matching the original table [2, 7]. The formula's units are albumin in g/L, creatinine in µmol/L, glucose in mmol/L, CRP in mg/dL (as its natural logarithm), lymphocytes in %, red-cell size in fL, red-cell size variation in %, alkaline phosphatase in U/L and white cells in thousands per µL [1].
The made-up example. The 50-year-old in the chart has albumin 43 g/L, creatinine 80 µmol/L, glucose 5.4 mmol/L, CRP 0.2 mg/dL, lymphocytes 28%, red-cell size 91 fL, red-cell size variation 13.2%, alkaline phosphatase 70 U/L and 6.2 thousand white cells per µL. These are illustrative values, not population averages.
How we estimated the noise. For each result we took published within-person and laboratory variation from healthy adults sampled weekly [9, 10]. The values used were: albumin 2.5% and 1.5%; creatinine 4.4% and 1.1%; glucose 4.7% and 0.6%; CRP 29.4% and 11.1%; alkaline phosphatase 5.3% and 2.8%; white cells about 10.6% (a rough average of the published figures for women and men) and 1.5%; lymphocytes 9.8% and 2.4% (measured as an absolute count, standing in for the share); red-cell size 0.7% and 0.2%; and red-cell size variation 1.65% and 0.57% (measured as RDW-SD, standing in for RDW-CV). Applied to the made-up example's values with the formula's weights and the 0.090165 constant, with CRP on its logarithmic scale and results and repeat tests treated as independent, these give a spread of about 1.4 years for one result. The upper figure of about 2.3 years is a sensitivity assumption, not published data: CRP varying by 100% from test to test, and red-cell size variation by 3.5% with 1.5% laboratory variation. If one result varies by 1.4 to 2.3 years, two single tests differ by more than about 3.8 to 6.3 years only 5% of the time; with two tests averaged at each time point, the figure is about 2.7 to 4.5 years. The shaded band in the chart shows the narrow case. Results that move together during illness could make the true spread larger or smaller, an infection can change the body rather than only the measurement, and a threshold like this cannot tell you the cause of a change.
Who the evidence covers. The US validation sample was about three-quarters non-Hispanic White, with 11% non-Hispanic Black and 13% Hispanic participants [2]. The lifestyle trial enrolled Saudi adults with prediabetes and did not conceal the allocation to groups beyond random assignment [13].
For people building health apps. The blood formula is published; the paper's patent statement concerns the DNA version [1]. Check units on input, state which constant you use, and show a range rather than a single number.
All references (22)
- Levine ME, Lu AT, Quach A, et al. An epigenetic biomarker of aging for lifespan and healthspan. Aging, 2018.
- Liu Z, Kuo PL, Horvath S, et al. A new aging measure captures morbidity and mortality risk across diverse subpopulations from NHANES IV: a cohort study. PLOS Medicine, 2018.
- Kuo CL, Pilling LC, Liu Z, et al. Genetic associations for two biological age measures point to distinct aging phenotypes. Aging Cell, 2021.
- Bortz J, Guariglia A, Klaric L, et al. Biological age estimation using circulating blood biomarkers. Communications Biology, 2023.
- Hao M, Zhang H, Wu Z, et al. Gompertz law-based biological age (GOLD BioAge): a simple and practical measurement of biological ageing to capture morbidity and mortality risks. Advanced Science, 2025.
- Wang K, Liu F, Wu W, et al. A full life cycle biological clock based on routine clinical data and its impact in health and diseases. Nature Medicine, 2025.
- Liu Z, Kuo PL, Horvath S, et al. Correction: A new aging measure captures morbidity and mortality risk across diverse subpopulations from NHANES IV. PLOS Medicine, 2019.
- Kwon D, Belsky DW. BioAge: biological age calculations using several biomarker algorithms (R package, phenoage_calc.R). GitHub.
- Carobene A, Aarsand AK, Bartlett WA, et al. The European Biological Variation Study (EuBIVAS): a summary report. Clinical Chemistry and Laboratory Medicine, 2022.
- Coşkun A, Carobene A, Kilercik M, et al. Within-subject and between-subject biological variation estimates of 21 hematological parameters in 30 healthy subjects. Clinical Chemistry and Laboratory Medicine, 2018.
- Higgins-Chen AT, Thrush KL, Wang Y, et al. A computational solution for bolstering reliability of epigenetic clocks: implications for clinical trials and longitudinal tracking. Nature Aging, 2022.
- Sehgal R, Borrus DS, Gonzalez J, et al. Biological versus technical reliability of epigenetic clocks and implications for disease prognosis and intervention response. Aging Cell, 2026.
- Alenezi A, Sabico S, Alnaami AM, et al. Structured lifestyle modification and biological aging: effects on PhenoAge, sclerostin, and GDF-15 in Arab adults with prediabetes. Frontiers in Aging, 2026.
- Waziry R, Ryan CP, Corcoran DL, et al. Effect of long-term caloric restriction on DNA methylation measures of biological aging in healthy adults from the CALERIE trial. Nature Aging, 2023.
- Bischoff-Ferrari HA, Gängler S, Wieczorek M, et al. Individual and additive effects of vitamin D, omega-3 and exercise on DNA methylation clocks of biological aging in older adults from the DO-HEALTH trial. Nature Aging, 2025.
- Fahy GM, Brooke RT, Watson JP, et al. Reversal of epigenetic aging and immunosenescent trends in humans. Aging Cell, 2019.
- Borrus DS, Sehgal R, Armstrong JF, et al. When to trust epigenetic clocks: avoiding false positives in aging interventions. Aging Cell, 2026.
- Quest Health. Complete blood count with differential; comprehensive metabolic panel; hs-CRP test product pages (accessed 12 November 2026).
- SYNLAB Hungary. Clinical chemistry, haematology and immunology price list, valid from 1 September 2026 (accessed 12 November 2026).
- Thriva. Advanced Longevity blood test (accessed 12 November 2026).
- Mito Health. PhenoAge blood test (company blog, 15 September 2026; accessed 12 November 2026).
- Pearson TA, Mensah GA, Alexander RW, et al. Markers of inflammation and cardiovascular disease: application to clinical and public health practice. Circulation, 2003.
The calculations described as ours (the formula comparison, unit slips and noise estimate) use the published weights and are explained under Evidence and methods; they are estimates from a simple model, not measurements. Prices are list prices seen on 12 November 2026 and can change; the euro figure is approximate. Company descriptions are the companies' own claims.