
On this page (4)Hide
Imagine opening a blood-test report and finding a different age beside each organ. Your heart gets one number, your brain another. How can a single sample tell so many stories—and what does an organ's “age” actually mean?
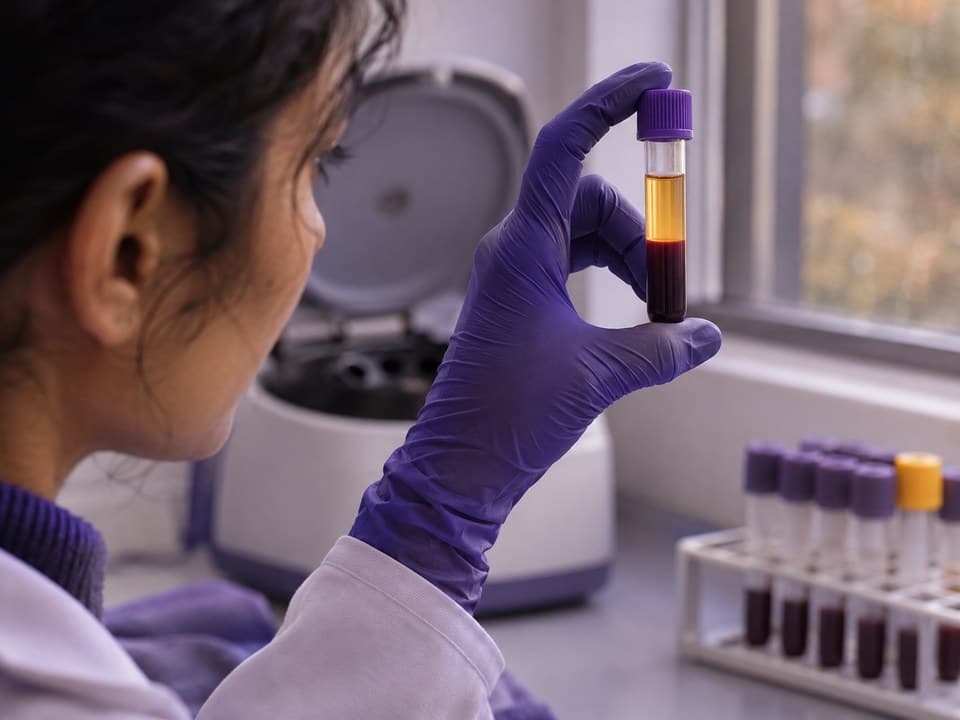

Blood contains a mixture of proteins, and some are more closely associated with particular organs than others. Researchers use that association to pick out groups of proteins that might tell them something about the heart, brain, kidneys and other organs [1].
The starting point is a map of where the genes that make those proteins are most active. A protein whose gene is especially active in the liver can be included in a liver-related group. That does not mean every molecule measured in the blood came from the liver: identifying the true sources remains a challenge [1, 2].
The measurement is still made in blood; the organ label comes from how the proteins were grouped [1].
The next step is to turn a protein pattern into a number. Researchers measure the selected proteins in people of different ages and train a model to predict calendar age. The model learns which combinations tend to occur at different ages. It can then place another person's pattern on that age scale [1, 2].
For a made-up example, imagine a 50-year-old receiving a heart estimate of 55. The useful question is how their heart-related protein pattern compares with people of the same age. An “age gap” describes how far the estimate lies above or below the model's usual estimate for people of that calendar age [2].
The heart has not acquired a different birthday. Nor has the test directly measured how well it pumps. It has produced an estimate from a selected set of blood measurements [1, 2].
Not every result called an organ or system age is made this way. Another approach, Systems Age, reads chemical tags on DNA in blood cells. Its developers built scores for body systems using clinical measurements and survival data. That makes it a different kind of model, even when the report also presents the result in years [3].

They can reveal differences that one overall age would hide. In large studies, organ-age estimates have moved together only partly. A person who scores older for one organ does not necessarily score older for all of them. Independent research groups have also found links between these estimates and later disease [2, 4, 5].
The overall estimate is separately trained on all measured proteins, not an organ average.
Sometimes the link is strongest for the organ named on the score. An older-looking heart pattern was associated with heart failure in the developers' study; an independent European study linked older kidney estimates with kidney cancer. These are associations across groups, not diagnoses for the people receiving a result [2, 4].
More numbers do not automatically make every prediction better. One independent study compared predictions of death using age, sex and either organ ages or an overall protein-age score. The approaches performed similarly [4].
Start with what the test measured. A protein-based estimate and a DNA-based system score can both be labelled “heart age”, yet come from different measurements and different models. Ask which approach produced the number before comparing it with another report [1, 3].
Even within protein clocks, the laboratory platform matters. Researchers measured the same samples on two protein platforms and applied models built for each. Across people, the two models gave related, but not identical, patterns of organ age gaps. The model and its version therefore belong in any explanation of the result [2].
Time adds another complication. In a study that repeated measurements roughly nine years later, some differences between people persisted, but many initially extreme estimates no longer crossed that cutoff. Over that interval, both the person and the measurement can change. The study cannot tell you how much variation to expect between tests a few weeks apart [2].
Some developers disclose patent applications and commercial ties, including company equity or consulting fees. That makes independent research especially useful, alongside a clear explanation of what the particular product measures [1, 2, 3].
The photographs and illustrations are AI-generated, not research images or photographs of any named company's laboratory, products or staff.- Oh HS-H et al. Organ aging signatures in the plasma proteome track health and disease. Nature, 2023.
- Oh HS-H et al. Plasma proteomics links brain and immune system aging with healthspan and longevity. Nature Medicine, 2025.
- Sehgal R et al. Systems Age: a single blood methylation test to quantify aging heterogeneity across 11 physiological systems. Nature Aging, 2025.
- Robinson O et al. Associations of proteomic age clocks with lifestyle risk factors, incident chronic diseases and mortality in two European cohorts. Nature Aging, 2026.
- Wang Y et al. Organ-specific proteomic aging clocks predict disease and longevity across diverse populations. Nature Aging, online 2025.
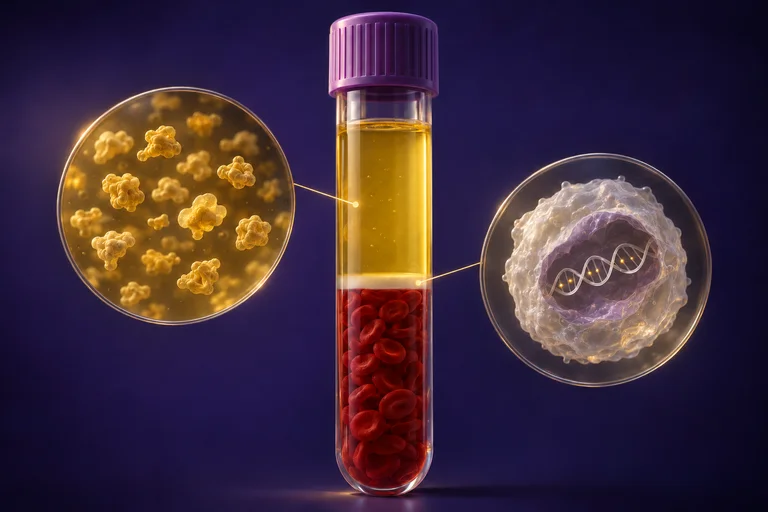
The figure "One tube, two readings" is a conceptual picture, not to scale: the layers show what blood contains, not how either test prepares a sample; one white cell stands for DNA from many cells, and the marks stand for methylation.